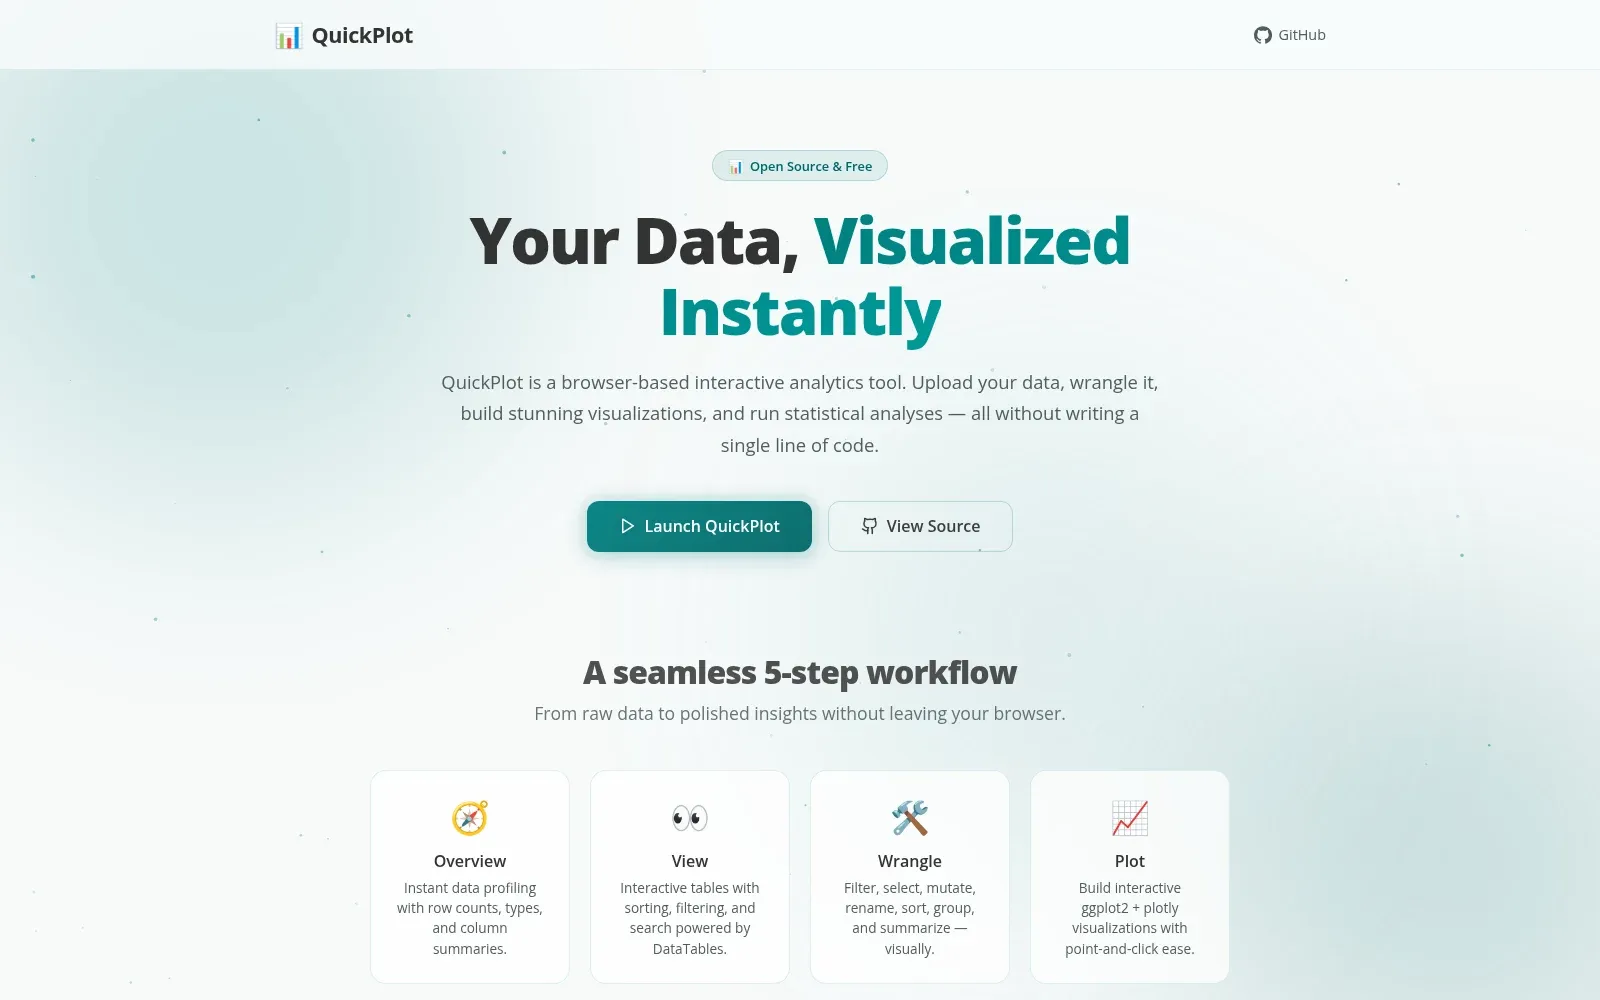
QuickPlot is a Shiny app for making a solid figure without writing any code. You upload a dataset, choose what goes on each axis, adjust the colors and labels, and download a publication-ready plot.
I built it for collaborators and students who had data and a clear picture of the chart they wanted but didn’t want to learn ggplot2 to get there. If you do want to learn it, ChartifyR has tutorials. It’s the short path from a spreadsheet to a figure you can drop straight into a slide or a paper.